CEC-Locean High Resolution 8 regions
High resolution SMOS-SMAP SSS maps in regions of high variability generated by LOCEAN/ACRI-ST Expertise Center
J. Boutin (jb@locean-ipsl.upmc.fr) – J.L. Vergely (Jean-Luc.Vergely@acri-st.fr) – L. Olivier – G. Reverdin – X. Perrot – C. Thouvenin-Masson
15 July 2022
Overview
LOCEAN and ACRI-st work as Ocean Salinity Center of Expertise for CATDS (CATDS CEC-OS) in order to improve methodologies to be implemented in the future in the near real time CATDS processing chain (CATDS-CPDC). They have derived a new methodology aiming at keeping high temporal SSS variability in highly variable regions while filtering outliers in low variability regions. This version 0 of the products are delivered in 8 regions. Feedbacks from users about the quality of these new experimental products are very welcome and essential for us to improve future versions of CATDS products.
Introduction
Global SSS products currently distributed by the CATDS CEC are smoothed over 9 days or 18 days and sampled every 4 days. In highly variable regions, like in river plumes, variations in surface salinity are expected on much smaller time scales. Knowledge of these regional variations is of interest for studying processes related to the fate of freshwater [Reverdin et al., 2021] and associated biogeochemistry [Olivier et al., 2022]. Hence, we have developed a new temporal interpolation scheme that intends to keep as much as possible high temporal frequency SSS variability (over typically one day or two).
Temporal resolution of satellite SSS products is limited by revisit times. The combination of ascending and descending SMOS passes allow revisit times of the order of 1.5 days. The addition of SMAP data makes it possible to consolidate this information. The regional products delivered here, as experimental products, were made using SMOS SSS only (up to April 2015) and using SMOS and SMAP SSS over more recent years, in a few highly variable regions.
Approach
As for the global 18-day CATDS CEC products, the high resolution (HR) products are built using a temporal interpolation, grid node per grid node. This interpolation is done simultaneously with the estimation of the across-track SSS biases [Boutin et al., 2018].
For the global products (CATDS CECv7), the time correlation kernels are Gaussian. Two successive estimates of the SSS are carried out for each grid node: an estimate of the SSS with an 18-day smoothing followed by an estimate of the SSS with a 9-day smoothing. 3-sigma outlier detection operations are conducted jointly and iteratively. The temporal interpolation follows a Bayesian scheme that allows a certain level of fluctuations in the solution. This level of fluctuation is driven by the a priori variance of the SSS. This variance is seasonally defined and depends on the position (latitude,longitude) of the grid nodes.
To estimate HR products with a better temporal resolution, we use a slightly different scheme. A one step retrieval with an 8-day exponential kernel is performed. Indeed, such exponential kernel allows to retrieve very sharp and continuous temporal fluctuations but not necessarily derivable. The broad sides of the exponential allow the salinity to be weakly correlated over a long time period, allowing to remove some orbital stripes.
The introduction of SMAP requires additional inter-sensor calibration. We consider here a differential calibration for the ascending, descending and forward and backward sights of SMAP (i.e. additional calibrations in addition to the SMOS inter-dwell calibrations similar to [Boutin et al., 2021]).
At the end of the process, in each grid point, the whole period SSS is calibrated using one quantile of ISAS SSS statistical distribution over the whole period [2010-2021] [Boutin et al., 2021].
Data
The satellite SSS data used are:
- SMOS CATDS v700 over the period [2010-2021]
- SMAP RSS v4.0 over the period [2015-2021].
The absolute calibration over the whole period is derived from ISAS20 (Argo) SSS maps (Kolodziejczyk et al. 2021) complemented by real time ISAS maps available at Copernicus Marine Service.
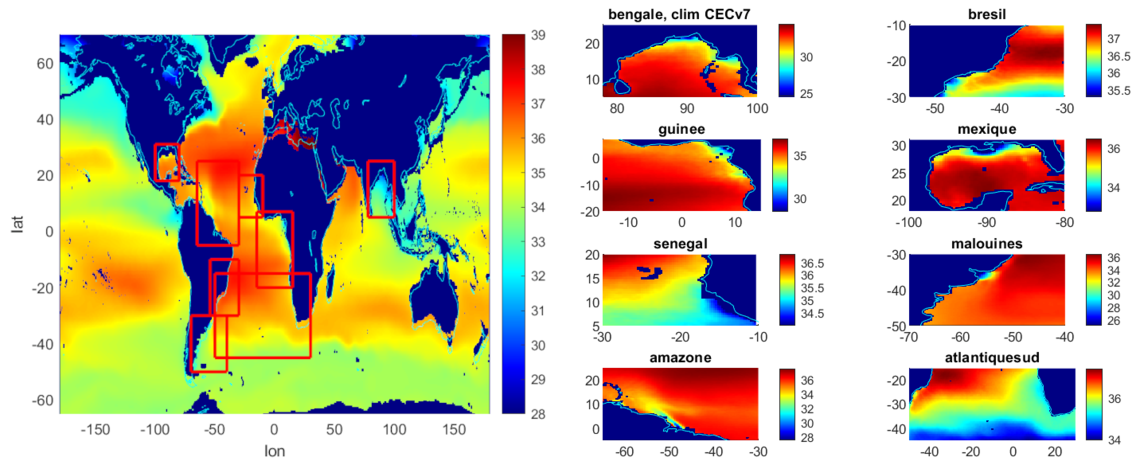
The areas of interest on which the tests are carried out are shown in Figure 1.
Figure 1: on the left, the 8 study areas are surrounded by a red rectangle; on the right, 10-year average salinity of the 8 study areas
The reference data used for validation, are InSitu Argo and TSG data collocated by the PI-MEP during the validation of the CATDS CPDC L3Q products. The performance indicators are calculated for selections on the depth of the InSitu data less than 5m, at +/-0.5 days in time.
Validation
In order to analyse the contribution of an exponential kernel with respect to a Gaussian kernel, we compare SSS fields obtained with an 8-day Gaussian kernel (similar to 9-day CEC CATDS maps) and the one obtained with an exponential kernel.
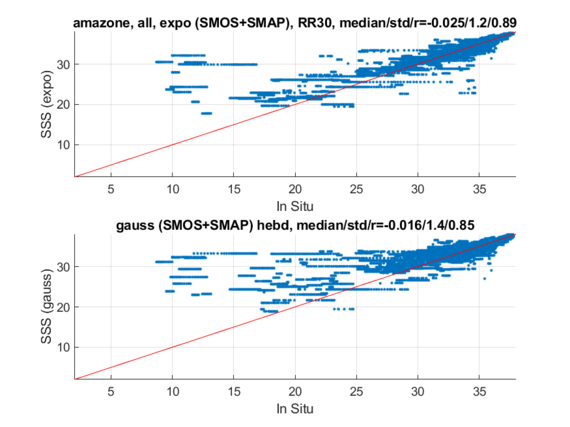
For the Amazon region, comparisons between InSitu measurements and satellite averages obtained from a Gaussian correlation (Figure 2 bottom) or an exponential correlation (Figure 2 top).
The exponential correlation processing provides a much better approximation to the InSitu data, especially in the [15-25] pss range. For lower values, the satellite SSS are too salty, regardless of the kernel used. This means that the absolute ISAS calibration is not satisfactory (ISAS data are systematically too salty in the river mouths so that even the high quantile of SSS distribution is biased).
Figure 2 : Comparison of SSSinsitu with satellite SSS over the Amazon region. Top, exponentially weighted time average, bottom, Gaussian weighted time average. Satellite SSS spatial resolution of 70km.
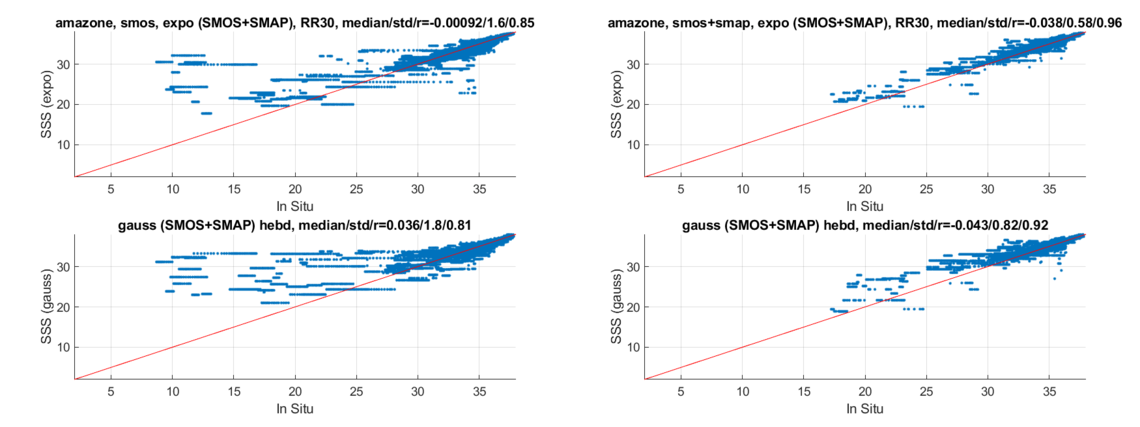
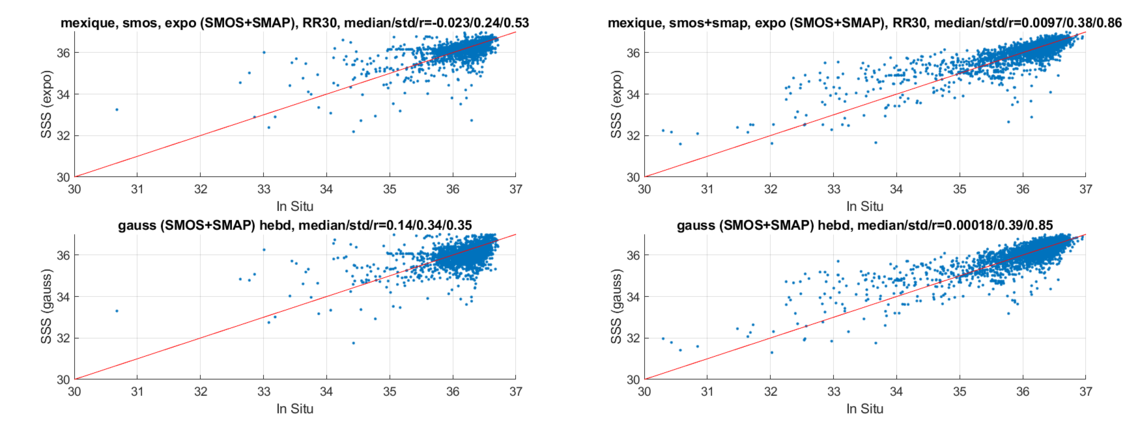
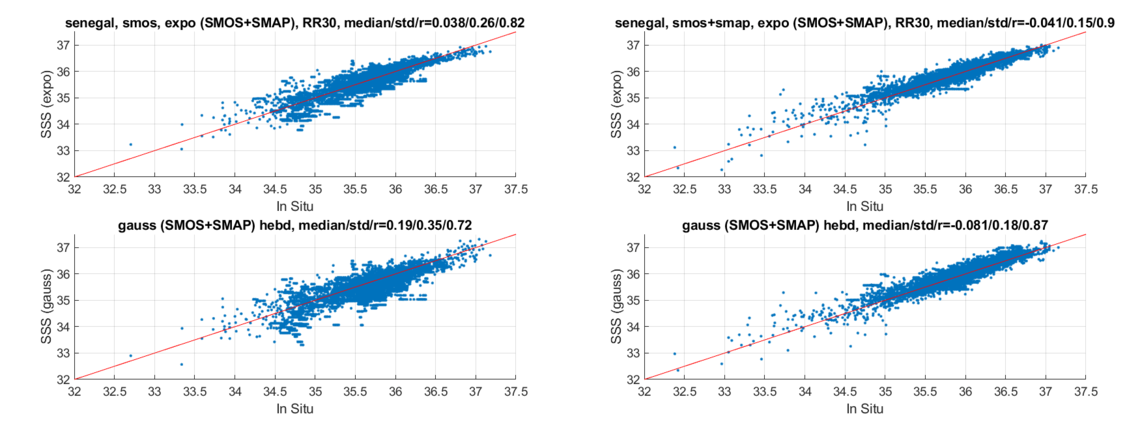
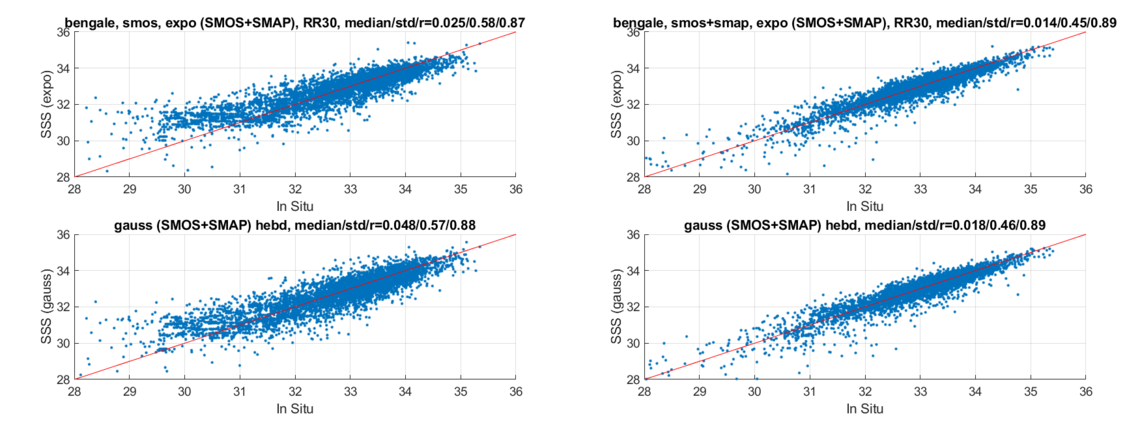
The time series can be split in two time periods: before and after 2015. The pre-2015 coverage is provided by SMOS alone, while after 2015 SMAP also contributes to the SSS estimation. We investigate whether, over the SMOS-only period, which has a time sampling of the order of 1.5 days, performance can be improved with an exponential kernel. Figure 3 shows that this is the case. Figure 4 and Figure 5 confirm this behaviour for the Gulf of Mexico and Senegal coastal areas respectively. In the Bay of Bengal area (Figure 6), there does not seem to be any significant gain.
Figure 3 : comparison of averaged SSS with InSitu data. Left: SMOS period only (before 2015); right: SMOS+SMAP period (after 2015). Amazon area, satellite SSS spatial resolution 70km.
Figure 4: idem Figure 3 for the Gulf of Mexico.
Figure 5: idem Figure 3 for the Senegal coastal region.
Figure 6: idem Figure 3 for the Bay of Bengal.
The use of the exponential kernel systematically improves performance over all regions except the Bengal area (Table 1).
Table 1: Metrics of validation (mean, std, r of the estimated SSS - SSSInSitu difference) for different configurations (Gaussian or exponential time correlation kernel, SMOS period only or SMOS+SMAP period). Satellite SSS spatial resolution of 70km.
Discussion and conclusions
The contribution of improved temporal resolution depends on the area under consideration. If the area has low temporal gradients, then temporal smoothing reduces the noise. On the other hand, in areas with strong gradients, a low level of smoothing would allow a better approximation of the InSitu data. The use of an exponential kernel seems to be a good compromise to filter out outlier in low variability areas and to keep high temporal dynamic in highly variable areas. Nevertheless this needs to be fully assessed with case studies by users.
Furthermore, temporal smoothing necessarily leads to spatial smoothing of the structures because the structures (mesoscale eddies, fronts) are moving. This "smearing" effect is difficult to estimate in the analysis of the temporal power spectra given that in situ data are not spatially integrated in space as satellite data.
Users stress the importance of temporal and spatial resolution for the study of processes especially in river plumes. We deliver experimental products in 8 regions.
The use of an exponential kernel for the temporal smoothing allows:
- an improvement of the spatial contrasts either on the SMOS period alone or on the SMOS + SMAP period on almost all considered regional areas.
- a better restitution of the temporal dynamics for the low SSS at the mouths of the river plumes
There is a substantial gain in the correlation indicators with the In Situ data in the SMOS+SMAP period with an exponential core.
Overall, there is no noise degradation with the HR products.
Moreover, there is a suppression of certain orbit "lineages" with the use of an exponential kernel.
Data reference
Boutin Jacqueline, Vergely Jean-Luc, Olivier Léa, Reverdin Gilles, Perrot Xavier, Thouvenin-Masson Clovis (2022). SMOS SMAP High Resolution SSS maps in regions of high variability, generated by CATDS CEC. SEANOE. https://doi.org/10.17882/90082.
Data policy
The CATDS data are freely distributed. However, when using these data in a publication, please use the following data reference and acknowledgement:
Boutin Jacqueline, Vergely Jean-Luc, Olivier Léa, Reverdin Gilles, Perrot Xavier, Thouvenin-Masson Clovis (2022). SMOS SMAP High Resolution SSS maps in regions of high variability, generated by CATDS CEC. SEANOE. https://doi.org/10.17882/90082.
"The CEC CATDS High Resolution V0 Sea Surface Salinity maps have been produced by LOCEAN/IPSL (UMR CNRS/UPMC/IRD/MNHN) laboratory and ACRI-st company that participate to the Ocean Salinity Expertise Center (CECOS) of Centre Aval de Traitement des Données SMOS (CATDS). This product is distributed by the Ocean Salinity Expertise Center (CECOS) of the CNES-IFREMER Centre Aval de Traitement des Données SMOS (CATDS), at IFREMER, Plouzane (France)."
References
Boutin, J., et al. (2021), Satellite-Based Sea Surface Salinity Designed for Ocean and Climate Studies, Journal of Geophysical Research: Oceans, 126(11), e2021JC017676, doi:10.1029/2021JC017676.
Boutin, J., J. L. Vergely, S. Marchand, F. D'Amico, A. Hasson, N. Kolodziejczyk, N. Reul, G. Reverdin, and J. Vialard (2018), New SMOS Sea Surface Salinity with reduced systematic errors and improved variability, Remote Sensing of Environment, 214, 115-134, doi:10.1016/j.rse.2018.05.022.
Kolodziejczyk Nicolas, Prigent-Mazella Annaig, Gaillard Fabienne (2021). ISAS temperature and salinity gridded fields - ISAS20_ARGO. SEANOE. doi:10.17882/52367#86442
Olivier, L., et al. (2022), Wintertime process study of the North Brazil Current rings reveals the region as a larger sink for CO2 than expected, Biogeosciences, 19(12), 2969-2988, doi:10.5194/bg-19-2969-2022.
Reverdin, G., et al. (2021), Formation and Evolution of a Freshwater Plume in the Northwestern Tropical Atlantic in February 2020, Journal of Geophysical Research: Oceans, 126(4), e2020JC016981, doi:10.1029/2020jc016981.
Product access
HTTPS access
This research product is freely available on HTTPS :
https://data.catds.fr/cecos-locean/Ocean_products/HIGH_RESOLUTION_8_REGIONS/
FTP access
This research product is freely available on FTP:
ftp ftp.ifremer.fr
user : ext-catds-cecos-locean
password : catds2010
chdir : Ocean_products/HIGH_RESOLUTION_8_REGIONS
or ftp://ext-catds-cecos-locean:catds2010@ftp.ifremer.fr/Ocean_products/HIGH_RESOLUTION_8_REGIONS (no longer works in the recent versions of most of the web browers)
Mailing list
If you want to register to our mailing list to be informed about major events, please send us a message at support@catds.fr (less than 10 messages / year).


